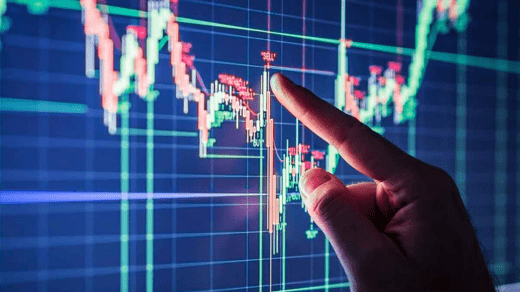
Day trading is a fast-paced and exciting way to participate in the financial markets. It involves buying and selling financial instruments within the same trading day, aiming to profit from short-term price movements. To be successful in day trading, traders often rely on various indicators that provide valuable insights into market trends and potential entry and exit points. In this article, we will explore some of the best indicators for day trading, empowering traders to make informed decisions and enhance their chances of success.
Moving Averages (MA)
Moving averages are fundamental indicators used by day traders to analyze the overall trend direction of an asset’s price. They smooth out price fluctuations over a specified period, making it easier to identify trends. The two most common types of moving averages are:
Simple Moving Average (SMA)
The SMA calculates the average price of an asset over a specific number of periods. It is widely used for its simplicity and effectiveness in identifying trend changes.
Exponential Moving Average (EMA)
The EMA places more weight on recent price data, making it more responsive to current market conditions. This can be particularly useful for short-term day traders.
Relative Strength Index (RSI)
The RSI is a momentum oscillator that measures the speed and change of price movements. It oscillates between 0 and 100 and is used to determine overbought and oversold conditions of an asset. Traders often consider a reading above 70 as overbought and below 30 as oversold.
Moving Average Convergence Divergence (MACD)
The MACD is a versatile indicator that combines moving averages with momentum. It consists of two lines – the MACD line and the signal line. Crossovers between these lines can signal potential trend changes and generate buy or sell signals.
Bollinger Bands
Bollinger Bands consist of a middle SMA line and two standard deviation bands. They provide a visual representation of an asset’s volatility, and when the bands contract, it suggests lower volatility, while widening bands indicate increased volatility. Traders can use Bollinger Bands to identify potential breakouts and market reversals.
Stochastic Oscillator
The stochastic oscillator compares an asset’s closing price to its price range over a specific period. It generates values between 0 and 100, indicating the asset’s position within the recent trading range. Traders can use it to identify potential trend reversals and entry or exit points.
Fibonacci Retracement
Fibonacci retracement levels are horizontal lines that indicate potential support and resistance levels based on the Fibonacci sequence. Day traders often use these levels to identify potential reversal points and areas of price consolidation.
Average True Range (ATR)
The ATR measures market volatility by calculating the average range between the high and low prices over a specified period. It helps traders assess the potential risk and set appropriate stop-loss levels.
Ichimoku Cloud
The Ichimoku Cloud is a comprehensive indicator that provides insights into support and resistance levels, trend direction, and momentum. Traders can use it to identify trading opportunities and assess the overall market sentiment.
Parabolic SAR
The Parabolic SAR (Stop and Reverse) is an indicator that provides potential entry and exit points based on price momentum. It appears as dots above or below the price chart and can help traders determine when a trend might be ending.
Volume
While not a traditional indicator, trading volume is an essential component for day traders. High trading volume often indicates increased interest and liquidity, making it easier to execute trades without significant price slippage.
Day trading requires a combination of skill, knowledge, and the right tools. Utilizing the best indicators for day trading can significantly improve a trader’s decision-making process and overall performance. Remember that no single indicator guarantees success, and it is essential to use a combination of indicators alongside proper risk management strategies.

